Reports, P&L, Profitability, and Export Surfaces – VariPOS Docs (v1.0.0+1 Offline Free) – Vari Logic InfoTech

VariPOS Documentation

Read module-by-module like an operations story. Every scene tells what to do, what to check, and what outcome to expect.

Analytics

Reports, P&L, Profitability, and Export Surfaces

Owner review time: profitability and operational performance get measured here.

Scene 1: P&L – Scene 1

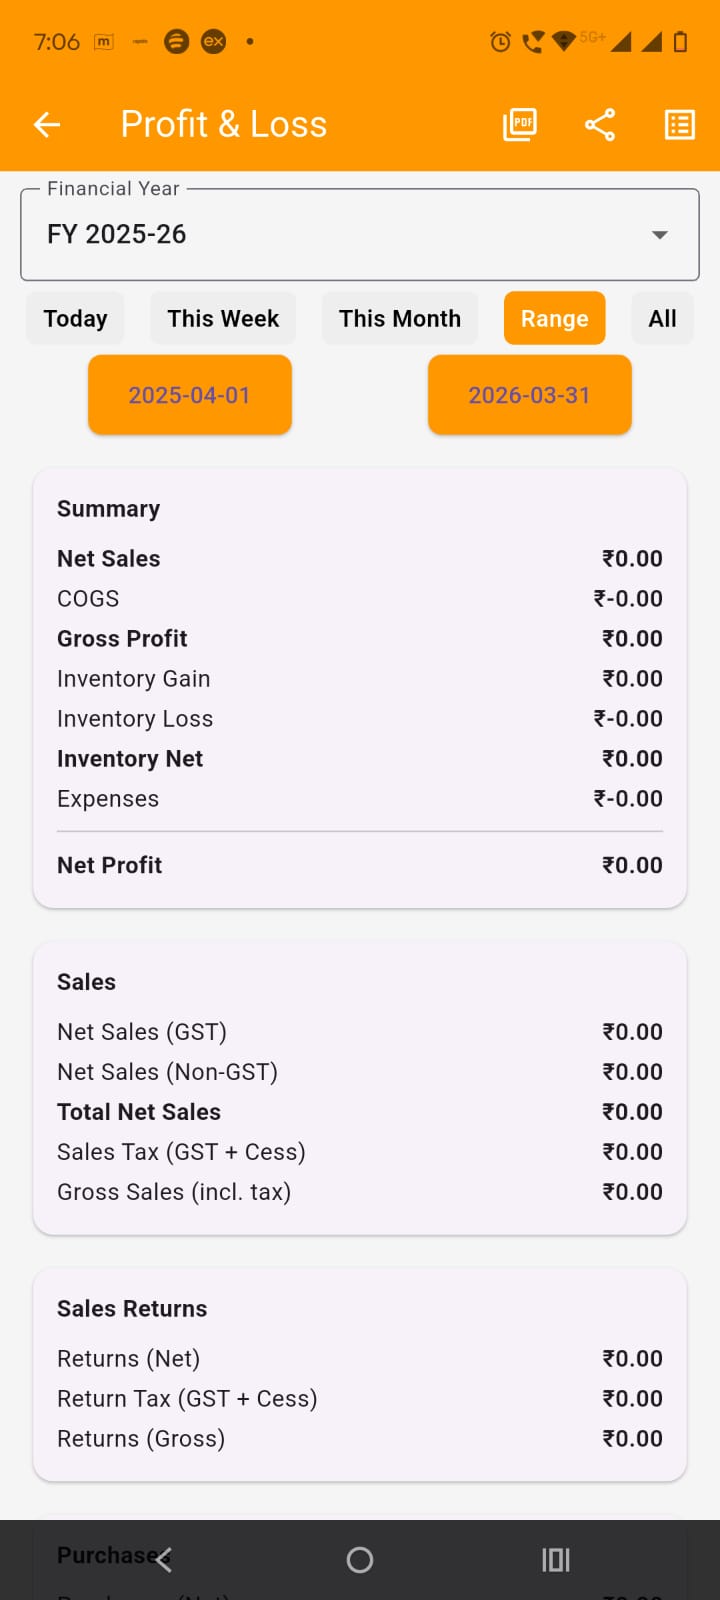
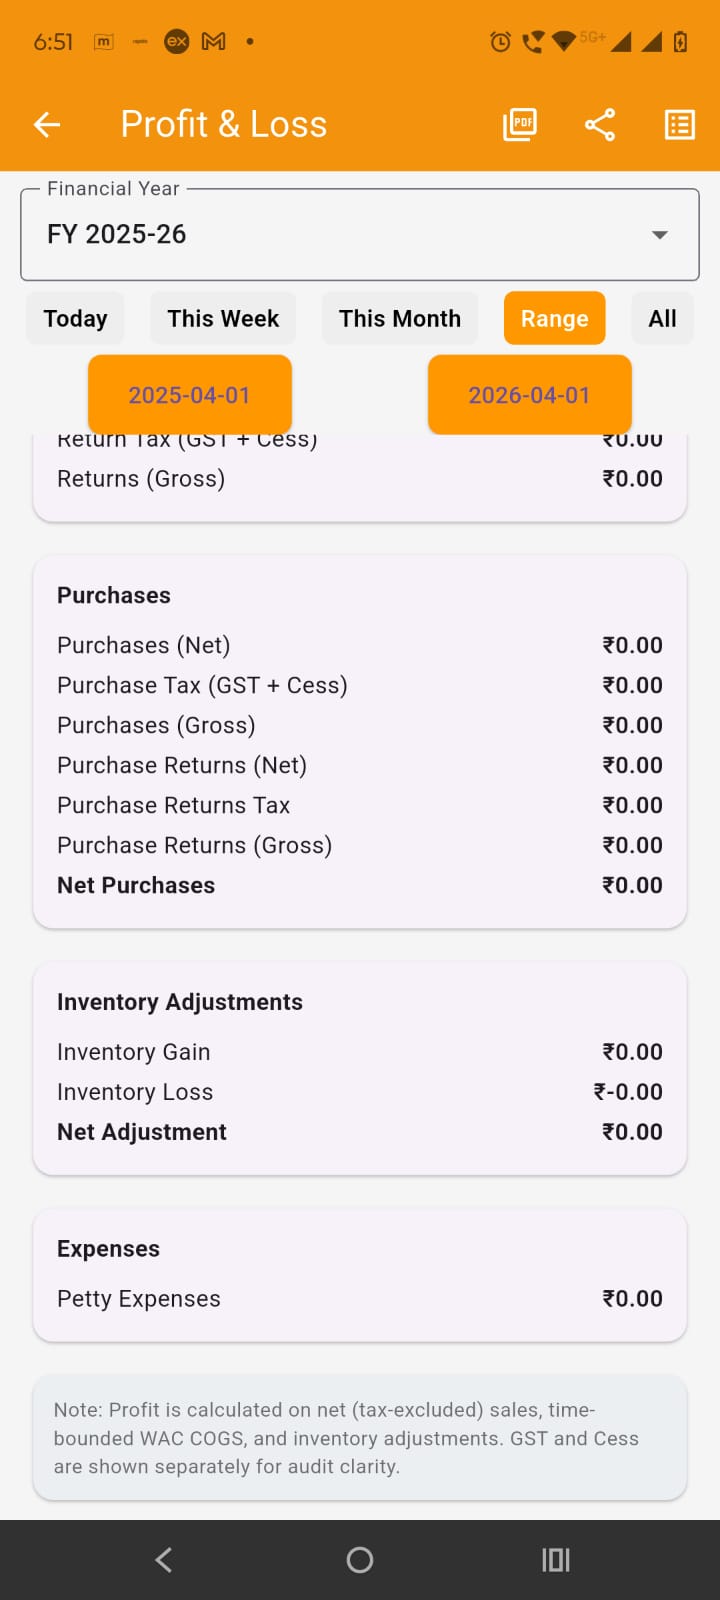
Profit & Loss is the main screen used to understand business performance for a selected period. It shows how sales, returns, purchases, inventory effect, and expenses combine into final profit or loss.

P&L – Scene 1 scene image

Step 1

Open the Profit & Loss screen
  • Open Reports.
  • Tap the Profit & Loss tile or simple tap on the Profit & Loss menu item.
  • The screen opens with the current financial year selected by default if available.

Step 2

Choose the period
  • At the top, use the Financial Year dropdown to switch to another FY.
  • Use the date chips or period tabs such as Today, Week, Month, Range, or All depending on what you want to review.
  • If Range is selected, use the date picker section to choose custom from and to dates.

Step 3

Step 3: Read the summary card
  • The first card shows the main result:
  • Net Sales
  • COGS
  • Gross Profit
  • Inventory Gain / Loss
  • Expenses
  • Net Profit

Step 4

Review section-wise cards by scrolling down to see separate cards for. Each card explains one part of the final profit calculation:
  • Sales
  • Sales Returns
  • Purchases
  • Inventory
  • Expenses
Step image

Step 5

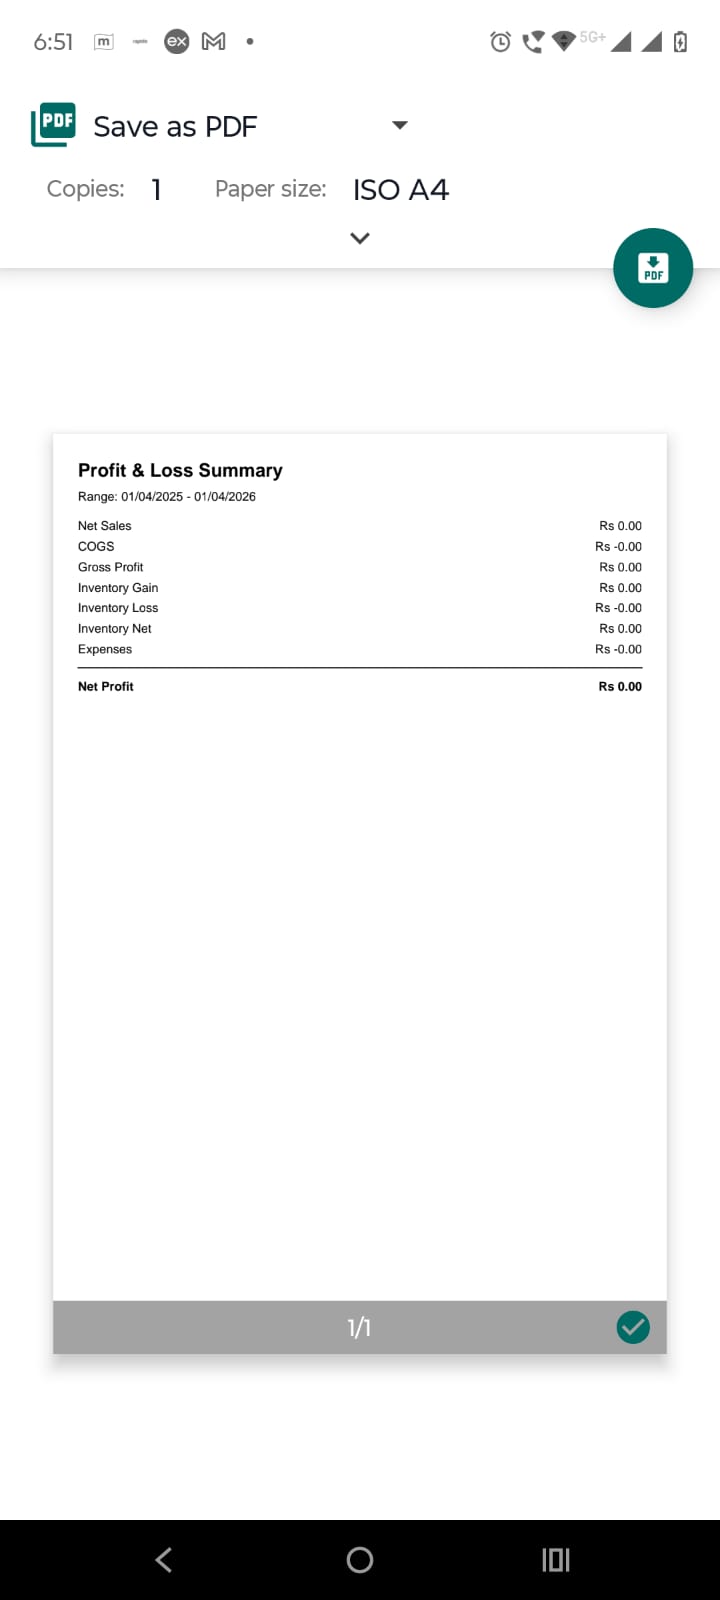
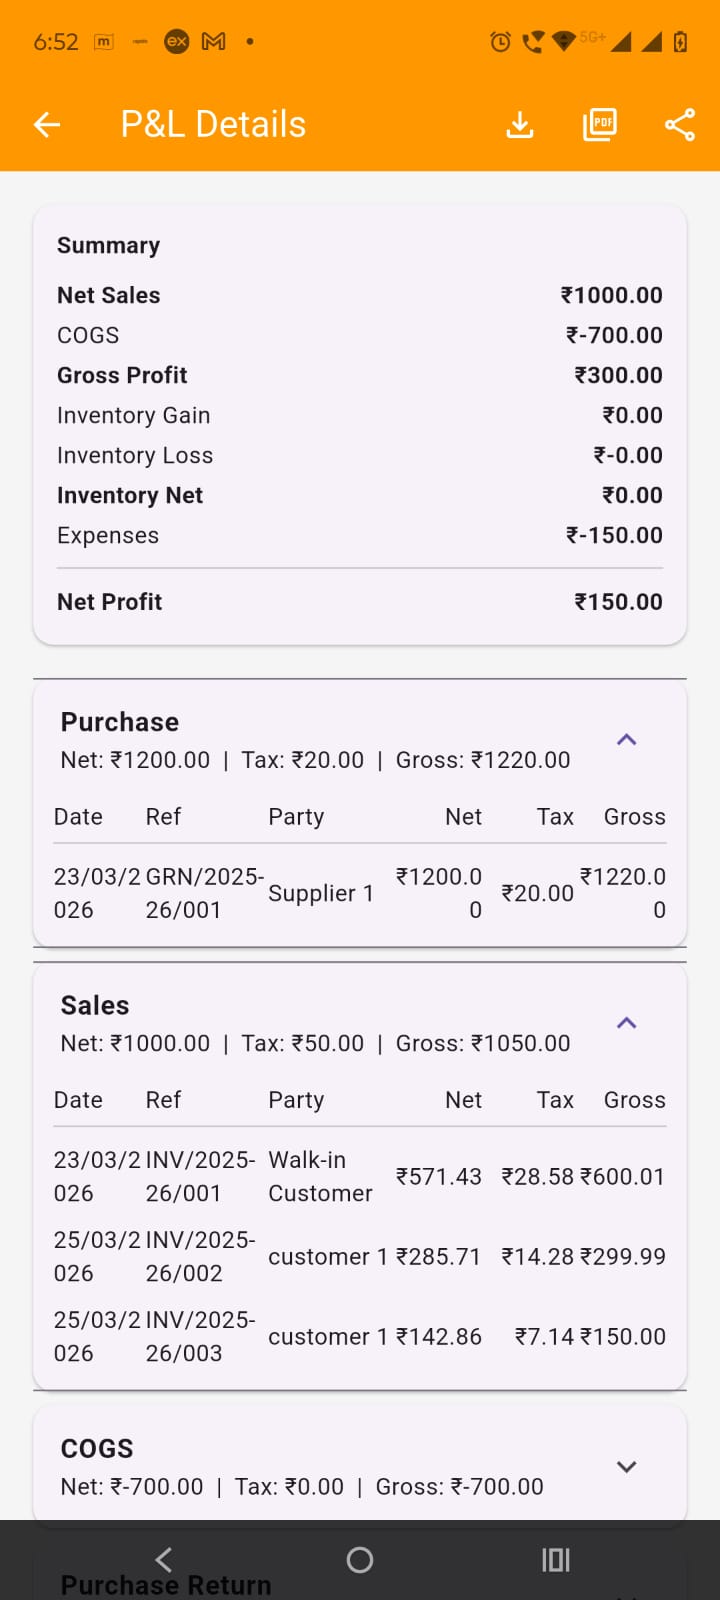
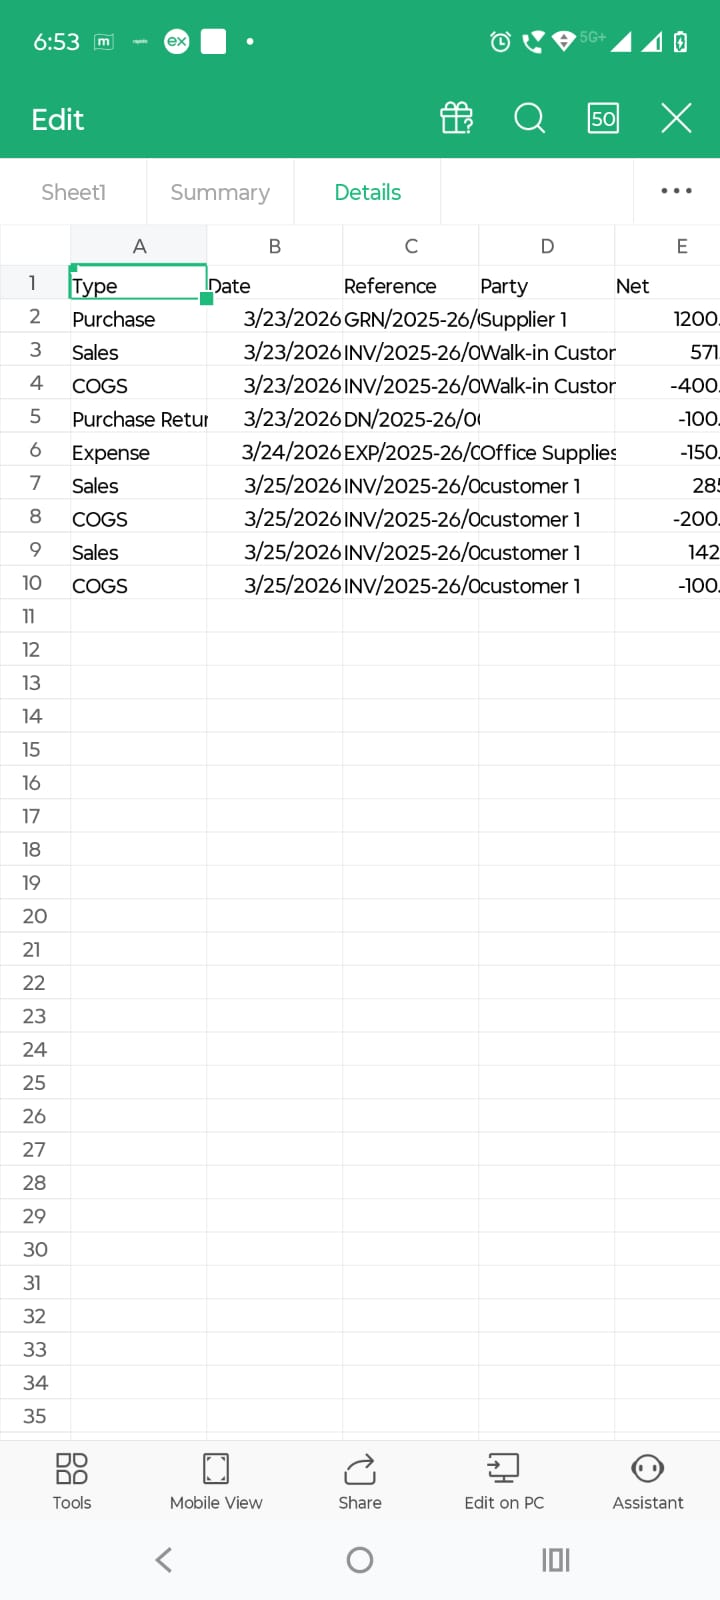
Open details screen: There are three icon buttons in the app bar of the profit & loss screen. First two prints and shares the profit & loss summary. The summary pdf is shown in the image below. Third button is for opening the profit & loss details screen of the date range selected in the profit & loss screen. Use the details screen when you want transaction-wise breakup instead of only totals.

Step image

Step 6

Use the P&L Details screen:

  • The details screen groups records type-wise.
  • You will see grouped sections with totals and expandable rows.
  • Each expanded group shows date, reference, party, net, tax, and gross values.
  • This is useful when you want to understand why profit changed.
Step image

Step 7

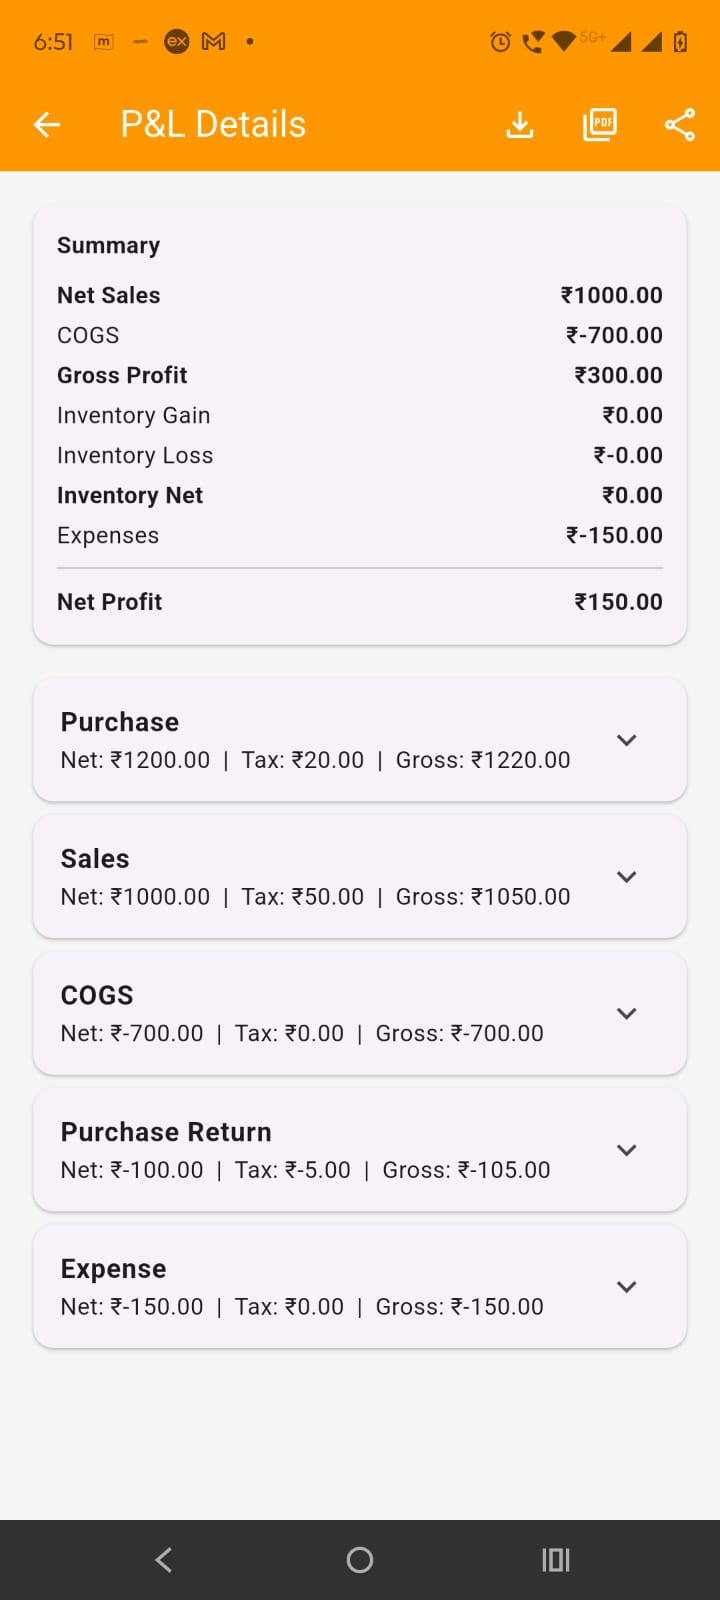
Study each card of the p&l details to understand the breakdown.

Step image

Step 8

Export detailed data
  • In P&L Details, tap the Excel Export icon to download workbook data.
  • The Excel export includes summary and detailed sheets.
  • Use this when you want to analyse, filter, or send structured data.
Step image

Scene 2: Reports – Scene 2

By tapping on the reports in menu or in dashboard, opens the reports screen. Reports is the central place from which you open analysis and compliance screens. It gives a quick business summary and then acts as the entry point to deeper reports.

Reports – Scene 2 scene image

Step 1

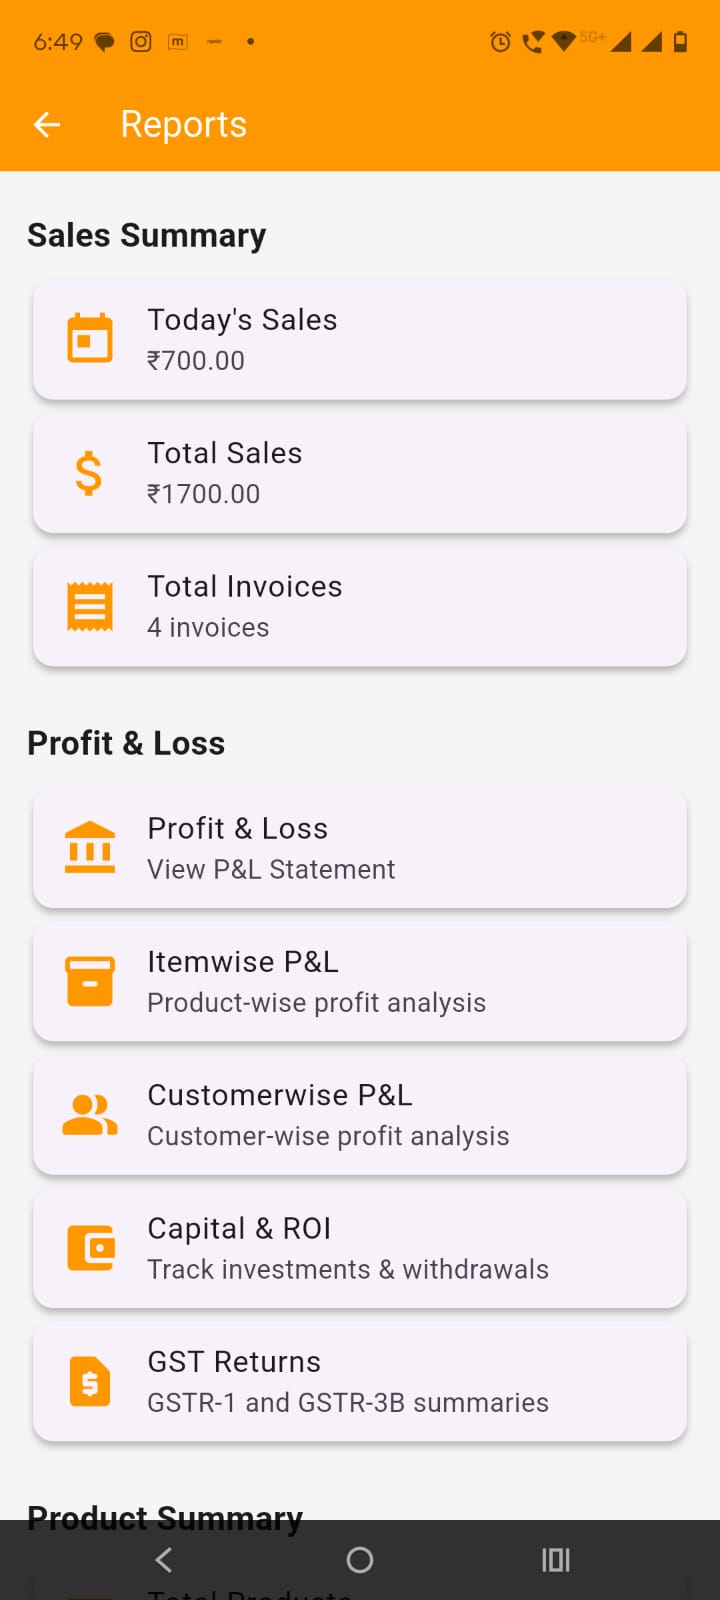
At the top, you will see summary cards such as:

  • Today's Sales
  • Total Sales
  • Total Invoices

Step 2

Scroll down and tap the required tile:

  • Profit & Loss for overall business result
  • Itemwise P&L for product-wise profit
  • Customerwise P&L for customer-wise profit
  • Capital & ROI for owner capital tracking
  • GST Returns for GST reports and filing workbooks

Step 3

Tap Itemwise P&L to open Itemwise Profit & Loss screen. On this screen:

  • Use the Financial Year dropdown or date icon to choose period.
  • Use search to find a product.
  • Use switches or filters like service inclusion or returns inclusion if shown.
  • Scroll the list to review item-wise sales, quantity, COGS, profit, and margin.
Step image

Step 4

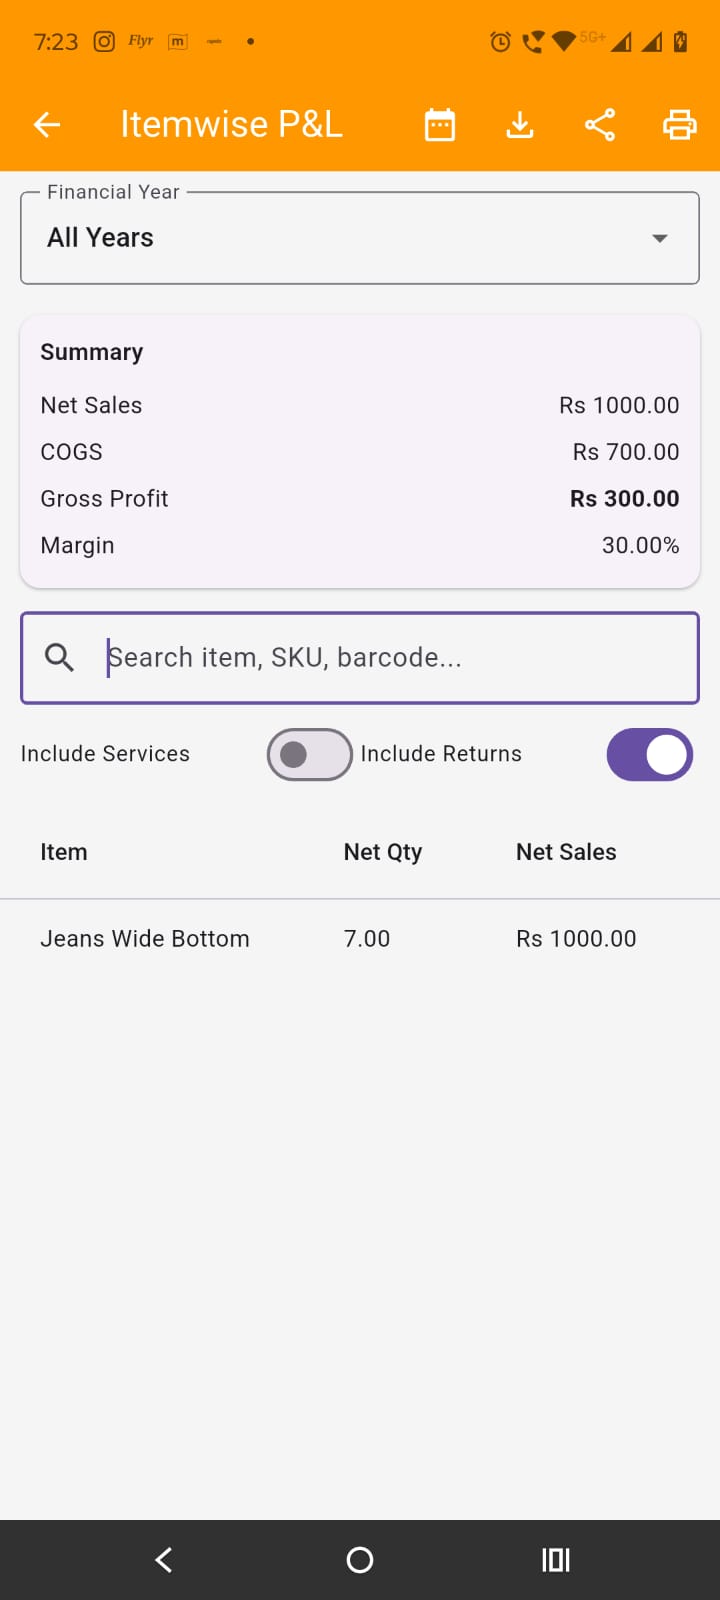
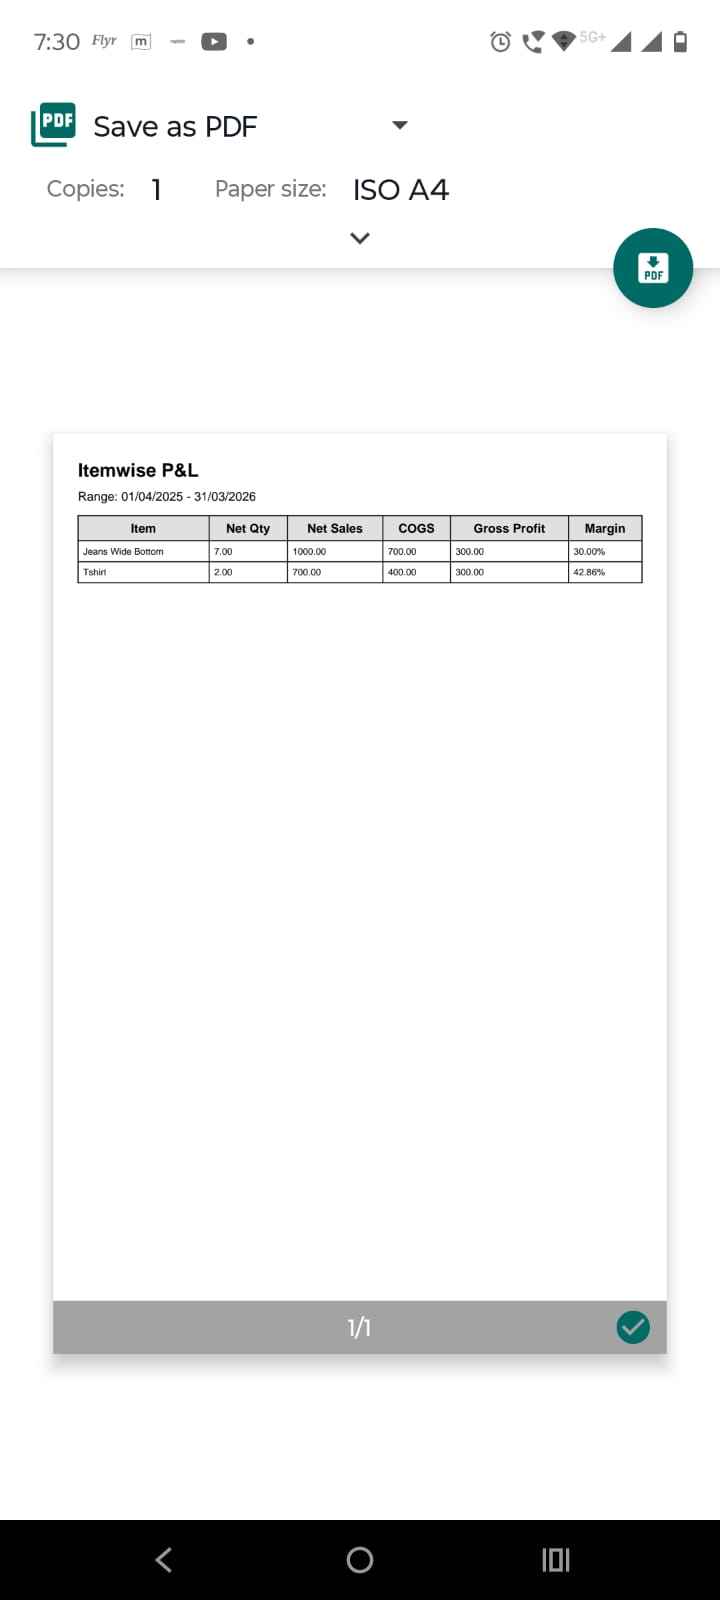
Use Itemwise P&L export actions:

  • Tap Excel Export to download item-wise data.
  • Tap Share PDF to send PDF.
  • Tap Print Preview to preview before printing.
Step image

Step 5

On Reports screen, tap Customerwise P&L to open customerwise profit & loss screen:

  • Use the period selector in the same way.
  • Search customer name if needed.
  • Review customer-wise net sales, COGS, gross profit, margin, received amount, and outstanding.
Step image

Step 6

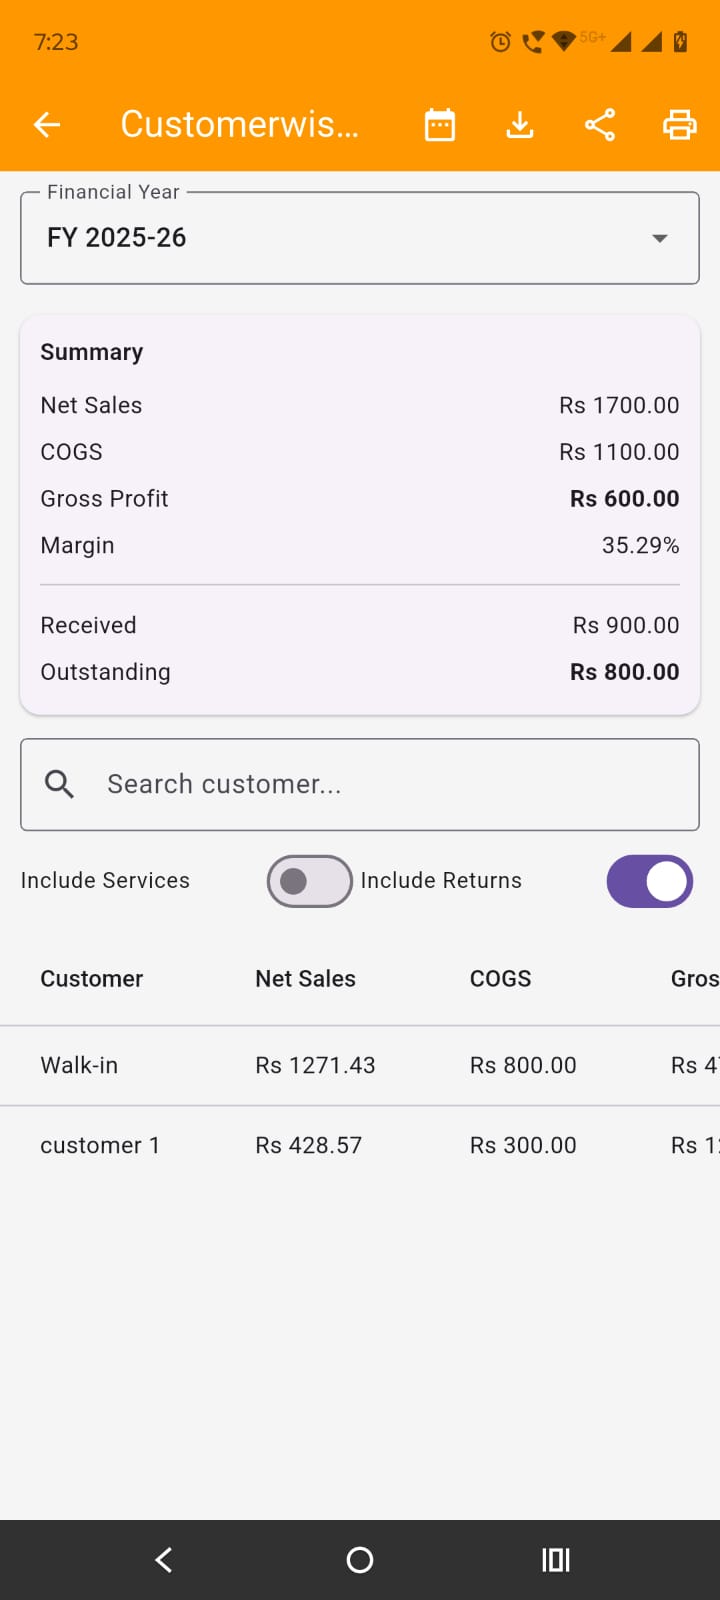
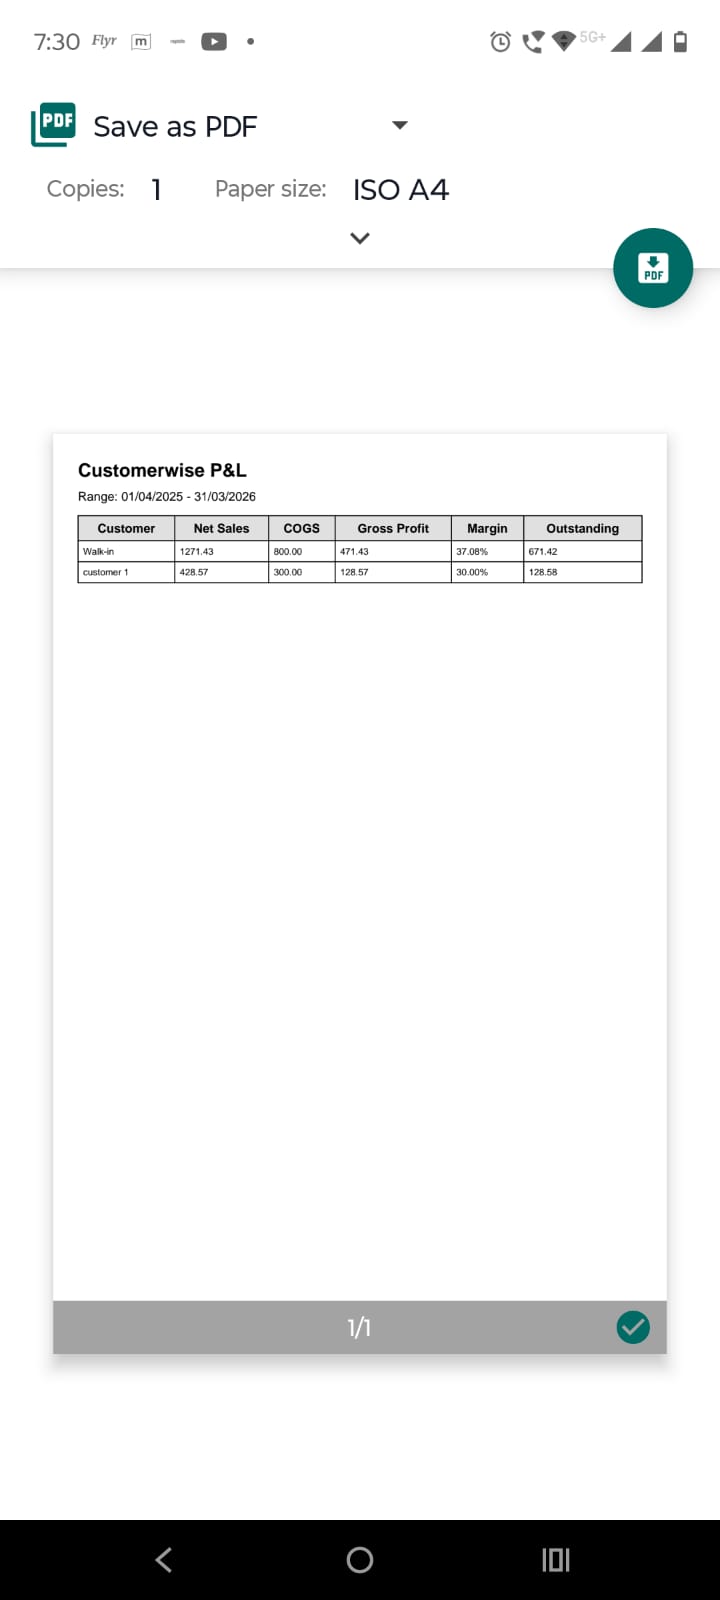
Use Customerwise P&L export actions:

  • Tap Excel Export to download customer-wise data.
  • Tap Share PDF to send a PDF report.
  • Tap Print Preview to view before printing.
Step image

Step 7

On Reports screen, tap GST Returns when you need GST summaries, filing data, or workbooks. This report is for compliance and filing preparation, not only management review.

Scene 3: Capital & ROI – Scene 3

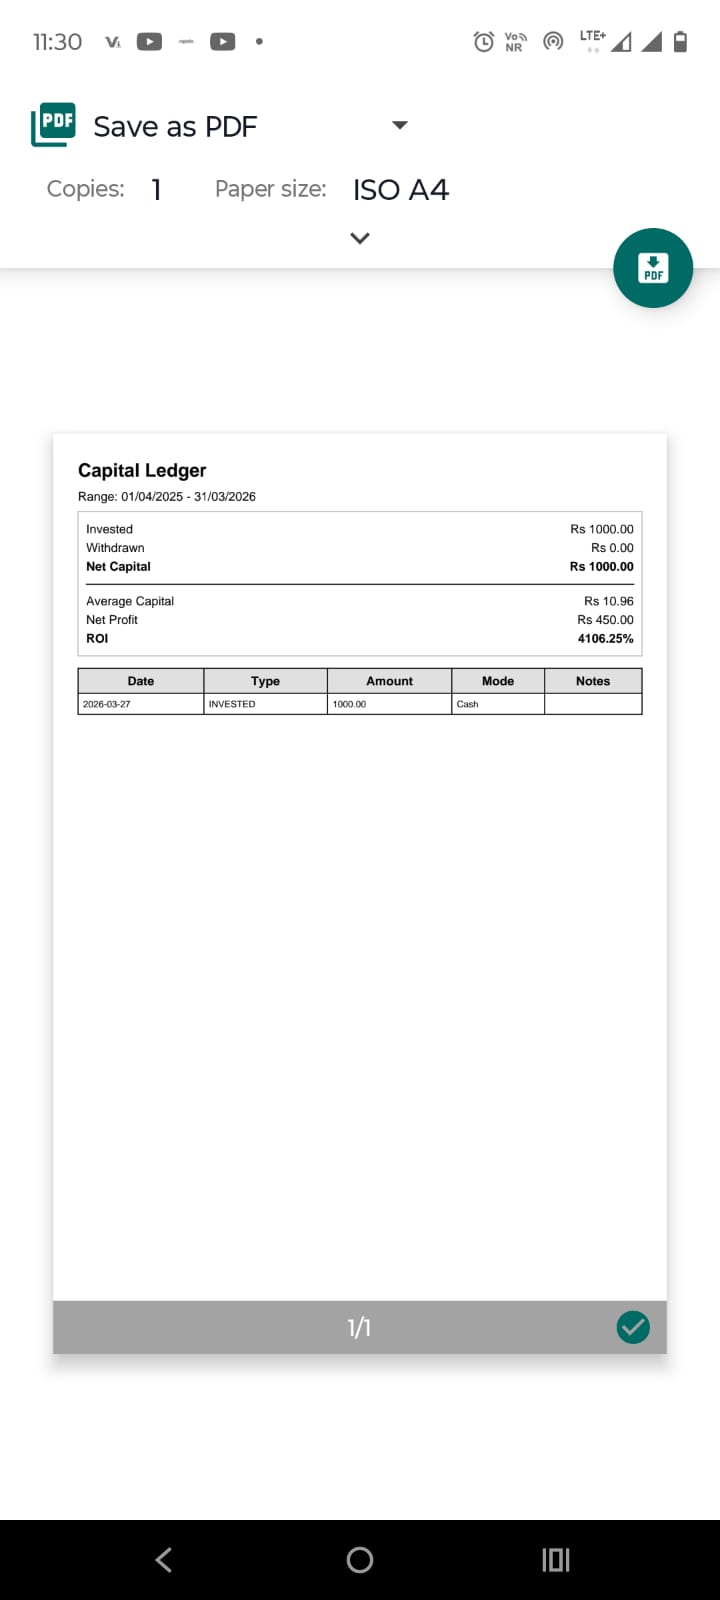
Tapping on the Capital & ROI tile on the reports screen opens the Capital & ROI screen. Capital & ROI is used to record owner capital movement and review capital-related summary for the selected period. It helps track how much money was introduced into or withdrawn from the business.
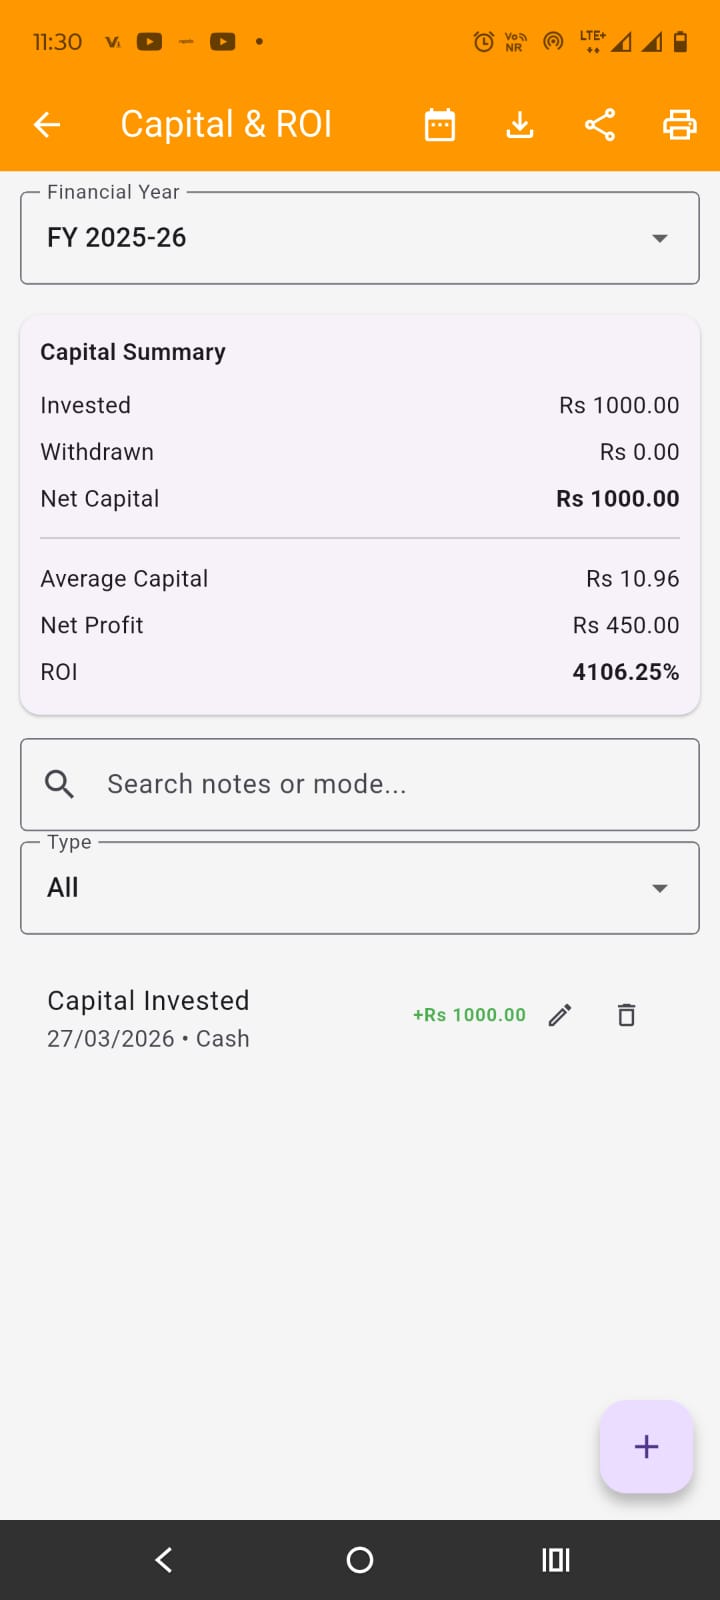
Capital & ROI – Scene 3 scene image

Step 1

Choose the period:.

  • Use the Financial Year dropdown to switch FY.
  • Tap the calendar/date icon in the app bar to pick a custom range.
  • The list and summary will refresh for the selected period.

Step 2

At the top, a summary section shows capital-related totals for the selected period. Use this first before checking individual entries.

Step 3

Search or filter entries:

  • Use the search box to search by notes or mode.
  • Use the type filter if available to narrow entries such as investment or withdrawal.
  • Scroll the list to view capital transactions page by page.

Step 4

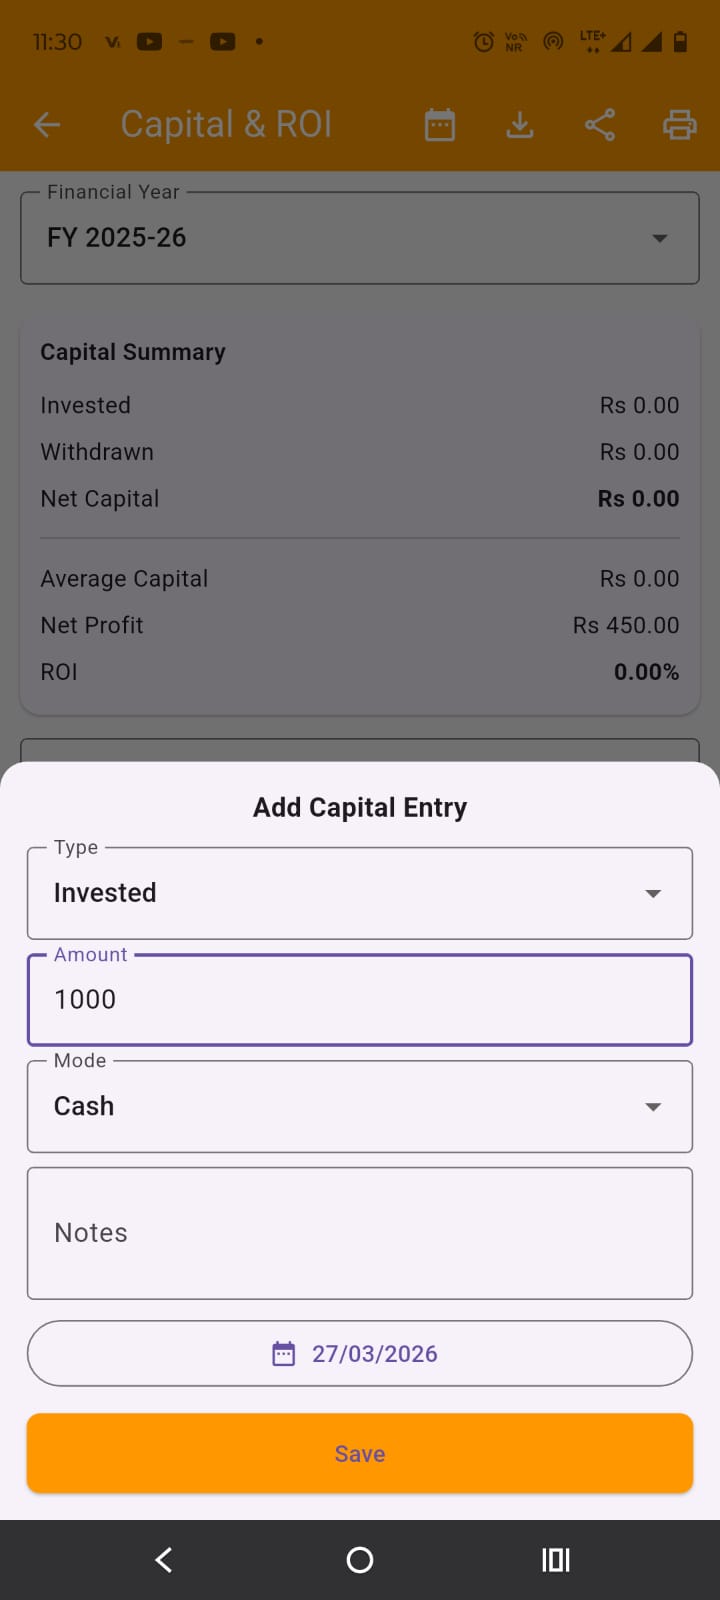
Add a new capital entry: Tap the + floating action button at the bottom of the screen. A bottom sheet opens for adding a capital transaction:

  • Select type from Invested or withdrawn.
  • Enter Amount.
  • Select Mode like cash etc.
  • Add notes and change date if required.
  • Press Save button to save capital entry.
Step image

Step 5

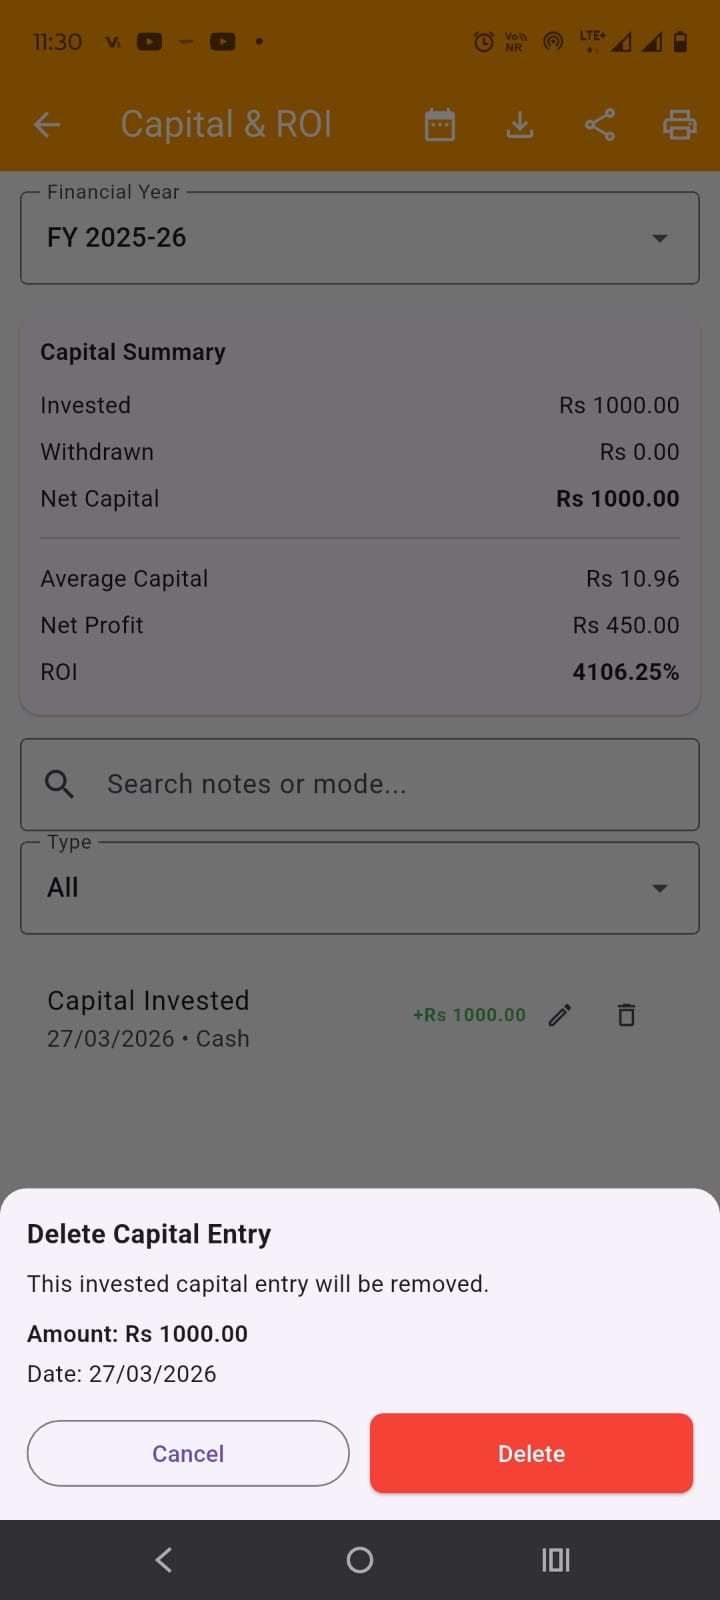
Below filters, capital entries are listed. you may delete a capital entry pressing delete icon before it. A popup will appear where you can confirm to delete it. You can also edit a capital entry by pressing edit icon button.

Step image

Step 6

Export capital data:

  • Tap Excel Export in the app bar to download the capital ledger.
  • Tap Share PDF to send the report as PDF.
  • Tap Print Preview to open preview before printing.
Step image